Calculating Supermarket POS Downtime: Count Disruption Without Inventing Losses
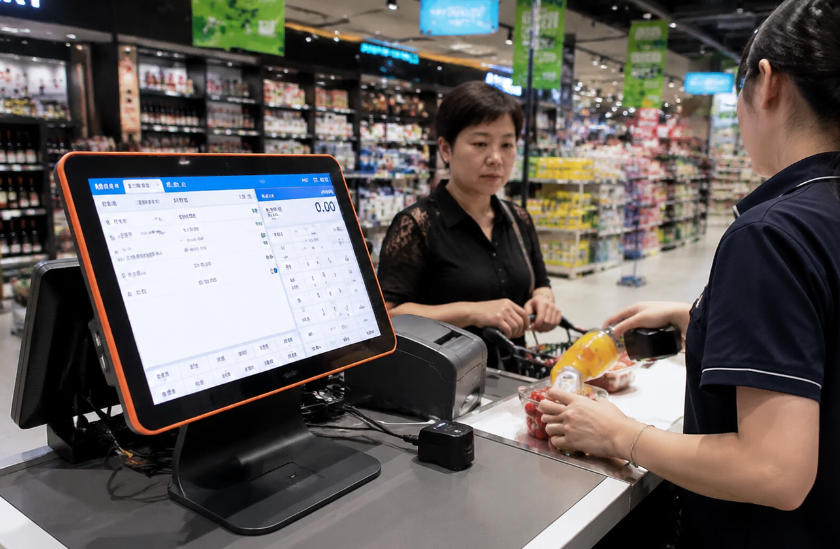
Estimate supermarket checkout downtime using actual incidents, diverted transactions, staff effort and recovery costs rather than unsupported revenue claims.
A failed supermarket lane creates disruption, but not every delayed sale becomes lost revenue. Some customers move to another lane, some abandon a purchase and some return later. A useful downtime estimate separates observed effects from assumptions so it can support maintenance and spare-stock decisions honestly.

Record the incident
Capture start and recovery times, affected functions, available lanes and the confirmed cause. Note whether the problem was hardware, application, network or payment service. Use queue observations and actual trading data where possible. Avoid estimating the entire store's sales as lost simply because one terminal was unavailable.
Build the cost worksheet
- Direct recovery: technician time, replacement parts and shipping.
- Staff effort: assistance, manual reconciliation and repeated work.
- Sales impact: distinguish deferred, diverted and demonstrably abandoned transactions.
- Secondary effects: refund handling or data correction supported by records.
- Prevention: compare spares, monitoring and planned maintenance with the observed risk.
Use ranges and review assumptions
Where a value cannot be measured, show a reasonable range and label it as an estimate. Compare similar incidents and identify recurring causes. A tested spare or corrected cable route may provide more value than a fleet replacement. The purpose of downtime analysis is to guide a proportionate response, not manufacture a dramatic loss figure for a hardware sales argument.